Showing posts with label Survey. Show all posts

Wednesday, July 3, 2013


Whenever Apple releases new software, consumers rush to give it a try. Now the average Apple user wants in on pre-release software once the domain only of developers and others paid to ensure everything is in order.
There has been such interest in the changes made to iOS 7 that this so-called ‘beta’ software is being adopted at a faster pace than test versions of iOS 6, one company noted Tuesday.
More than twice as many iPhones are online with the beta version of iOS 7 than was the case when the pre-release version of iOS 6 was made available to developers, according to a company which optimizes websites for mobile users.
Why the heightened interest in software declared not ready for mass use? How is Apple responding to this trend?
As of June 17, iOS 7 betas accounted for 0.46 percent of the firm’s total traffic, nearly double that of the iOS 6 beta which registered 0.25 percent over the same period in 2012, according to mobile web optimizing irm OnSwipe, via TechCrunch.
Individually, 0.77 percent of iPhones and 0.28 percent of iPads were detected running the test version of Apple’s mobile software. This compares to 0.38 for iPhones and 0.19 percent of iPads found to be running last year’s pre-release iOS 6.
Why the increase in interest in Apple’s pre-release software?
There are many possible explanations.
Firstly, with the introduction of so many new features, as well as a totally-revamped “flat” user-interface, developers are showing twice as much interest in retooling their apps to look best in the new digs.
Secondly, consumers have followed the twists and turns regarding this version of iOS in the most minute detail. As author Darrell Etherington points out, there was a record audience to hear Apple CEO Tim Cook and others describe software and products not likely to appear on shelves until this fall.
In response to the growing interest in its pre-release software, Apple is clamping down on its retail employees, ensuring the company speaks with one voice when it comes to iOS.

Some retail Apple employees have said they were threatened with firing if they showed the iOS 7 beta installed on their personal iPhones to customers. At the same time, Genius Bar workers were also admonished against servicing customers who had the beta installed on their handsets.
It’s a wonder how long Apple can continue this two-track way of marketing.
Hyping its next software while trying to control the message is a bit like poking a lion to prompt it to growl while making sure you’re not eaten.
Meanwhile, the third iOS 7 beta is expected to appear July 8.
Read More

Saturday, June 29, 2013


You have a whiz-bang idea for an iOS app, but want to know how much effort it will take to get into the top 10 list? On general, it requires 4,000 daily downloads for an app to reach the top 10 paid apps, and it requires earning $47,000 per day for paid apps to reach rank 10 in the grossing charts, a new study finds. For the bean-counters in the audience, that translates to $32 in purchases per minute or $1,920 per hour.
Another tip: never try to break into the top 10 during weekends. Instead, you’ll have better luck on Thursdays. If you want little competition, try Google or Amazon, where all you hear are crickets chirping, according to an app analytics firm…
The numbers from Distimo’s monthly iOS App Store trends report, averaged app revenue and downloads during May. According to the report, apps looking to become No. 50 need on average to pull in $12,000 per day, less than one-third of that required to break into the top 10.
For free apps it’s all about downloads.
To enter the top 50, your app must get 23,000 downloads per day. Around a three times more downloads – 72,000 – are needed each day to enter the top 10 at Apple.

If the challenge is too stiff, you might want to focus on iPad-only apps.
A paid app needs to gross just $10,200 per day for top 50 status. For free apps aiming for the top 50 iPad list, you need just 8,200 downloads each day, nearly three times fewer than for iPhone apps.
Maybe competition for iPhone and iPad app status is too much for you.

If so, check out Google Play or even Amazon’s Appstore. A No. 50 app on Google Play earned $6,600 per day during May – half the $12,000 raked in at Apple’s iOS App Store.
The numbers are even more miserable at Amazon. It requires only 2,500 downloads per day to make it into the top 50 at Amazon – 9 times fewer than at Apple.
As in many things in life, timing can be everything – and that includes making it big at Apple’s App Stores.

For instance, weekends mean a crush of competition as apps compete for a slice of a huge audience. Think of it as the App Store equivalent of the rush hour.
Instead, you might be better off trying on Thursdays, which demand the fewest number of downloads to rank on the App Store.
Today’s findings aren’t that surprising, given Distimo’s previous report which found the top App Store earnings brought in 4.6 times that of top apps on Google Play.
And this is why there is such a demand to break into the App Store and the others are left to the crickets.
Read More

Friday, June 28, 2013

Apple remains #1 smartphone maker in U.S.


If anyone needed confirmation, the U.S. smartphone market can be summed up in two words: Apple and Samsung. Those are the findings by measurement firm comScore, with Apple increasing its lead as the nation’s top smartphone brand. The iPhone maker had 39.2 percent of the domestic market at the end of May, growing its share 0.3 points.
Samsung also improved on its February second-place showing, growing 1.7 percentage points to capture 23 percent of the American market. Meanwhile, Google’s Android remains the No. 1 smartphone platform in the U.S., although Apple’s iOS inched up during the three-month period which ended in May…
Apple’s position as leading smartphone maker in the U.S. rose to 39.2 percent of the market, up 0.3 percent from the earlier 38.9 percent, according to comScore. Samsung increased its standing by 1.7 percent, up from 21.3 percent. HTC, Motorola and LG rounded out the top five smartphone makers sold in the United States.
In the battle for smartphone platform, Google’s Android increased its lead with 52.4 percent of the U.S. market, comScore said Friday. Although that was less than a one-percentage point gain over February, it was twice the growth of Apple’s iOS.
The report found Apple had 39.2 percent of the American smartphone market, up 0.3 percent from an earlier 38.9 percent.
BlackBerry was the No. 3 smartphone platform in the U.S., registering 4.8 percent of the market in May, a slip of 0.6 percent from February’s 5.4 percent – not surprising for a system consumers recently voted as the ‘most not wanted to own’.
Microsoft was fourth with 3 percent of the domestic smartphone subscribers, a 0.2 percent drop, according to the analytics company. Symbian was in the basement and quickly heading for absolute zero. The platform had 0.4 percent of the U.S. smartphone market, down from a half of one percent in February.
Both categories show that the Apple/Android duopoly is solidifying at the expense of other brands. While Microsoft touts its Windows 8 slate, it remains a distant fourth with U.S. market share in the single-digits.
As for BlackBerry, it has announced it will not install its new messenger app on the Playbook, thereby effectively closing the book on the company’s tablet plans.
Read More

Monday, June 17, 2013

Forrester: iOS is shoppers’ platform of choice


Owners of mobile gadgets running on Apple’s iOS operating system are more likely to make purchases from their iPhone, iPod touch or iPad and use their iDevices for product research. According to research firm Forrester, iOS owners are nearly one-third, or thirty percent, more likely to make purchases using their smartphone or tablet and fifteen percent more likely to research products, compared to Android users.
Although Apple’s software is overwhelmingly chosen by shoppers, 96 percent of e-businesses planned to develop mobile applications for both Android and iOS. However, while companies such as Microsoft and others encourage developers to create apps for their platform, only very large companies intend to stray from the iOS-Android duopoly…
The prime reason for sticking with iOS and Android: budgets for developing mobile apps are a drop in the bucket compared to money spent on overall marketing.
Some 41 percent of businesses have just $500,000 to spend on mobile, while more than half (56 percent) have under $1 million, according to the Forrester report that polled some 50,000 U.S. professionals.
Because developing apps for iOS and Android requires much from companies, fewer resources are allocated to building mobile products for other platforms.
Per TechCrunch:
The more resources developers have to devote to catering to those top two platforms, the fewer they have available to spread out on a third or fourth horse, to the continued detriment of smaller players like BlackBerry and Microsoft.
Indeed, BlackBerry announced in May its much-vaunted BlackBerry Messaging app would be available for both iOS and Android. And over at Microsoft, they even held a workshop to convince developers to write for its Windows platform.
Read More

Tuesday, March 26, 2013


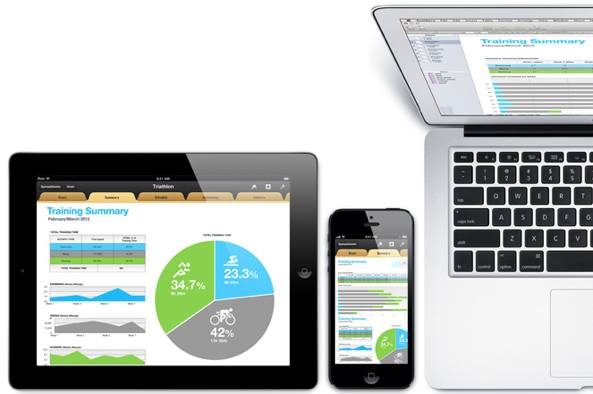
Apple devices 001 (iPad, iPhone 5, MacBook Air)
Research firm IDC today shared an interesting data point which again reminds us that the mobile game has pretty much come down to the epic fight for supremacy between California-based Apple and Seoul-headquartered Samsung group. Combined shipments of desktop and notebook PCs, tablets and smartphones rose to 378 million units in the fourth quarter of 2012, accounting for $168 billion in quarterly sales.
One particular data point has piqued our interest: thanks to the (sarcasm alert) “disappointing” iPhone 5 and “overpriced” iPad mini, Apple closed the gap with the South Korean giant, having accounted for a 20.3 percent unit share versus 21.2 percent for its rival.
And, of course, when you narrow down the analysis to just revenues, Apple’s high-margin business has allowed the company to pull in the market-leading 30.7 percent revenue versus 20.4 percent revenue share for Samsung.
In other words, nearly one out of every three dollars spent on desktop/notebook PCs, smartphones and tablets in Q4 2012 went to Apple, with Samsung taking one out of each five bucks…
According to IDC, global shipments of smart connected devices in 2012 rose 29.1 percent versus 2011, largely thanks to a whopping 78.4 percent growth in the tablet category where Apple’s iPad is a market leader.
Tablet shipments for the calendar 2012 surpassed 128 million units, with total smart connected device shipments (notebook/desktop PCs, tablets and smartphones) hitting one billion units with a value of $576.9 billion.
IDC connected mobile devices
Meanwhile, the good ol’ PC continues on a downward spiral.
The research firm, best-known for making wild predictions a few years into the future, projects tablet shipments to surpass desktop PCs in 2013 and portable PCs in 2014.
Given the iPad’s tablet lead, Apple stands to benefit the most should IDC’s estimates prove realistic. Globally, IDC expects PC desktop shipments to drop by 4.3 percent this year, with the notebook category maintaing a flat growth of 0.9 percent.
In peering into its crystal ball, IDC has concluded that the worldwide smart connected device market will reach 2.2 billion units shipped by 2017 for an astounding $814.3 billion in revenue, mostly driven by “a huge growth potential in the emerging markets” such as India and China.
Contrast this to tablets that wil reach a new high of 190 million units in 2013 for a healthy annual growth of 48.7 percent. The smartphone market is slowing and will grow an estimated 27.2 percent to 918.5 million units this year.
Another noteworthy factoid to glean form the report: 378 million devices shipped in the holiday quarter of 2012 alone, with a combined worth of more than $168 billion. This means that Apple’s IDC-estimated 30.7 percent revenue share translates into a cool $51.58 billion worth of MacBooks, iPhones and iPads sold in Q4 2012.
Notably, Apple’s own earnings cite $54.5 billion in fourth-quarter sales.
Piper Jaffray analyst Gene Munster noted today that we shouldn’t expect any major new product launches from Apple until June’s iPhone 5S introduction (no new iPad for you this Spring).
In turn, he says, Apple’s second-quarter revenue will fall short of Wall Street’s projections.
We also reported yesterday that investors are expecting a record revenue for Apple’s June quarter, but also a lower income due to lower margins from all the new products Apple introduced in the past six months.
Read More

Friday, March 22, 2013

iPhone and Galaxy owners are not that different


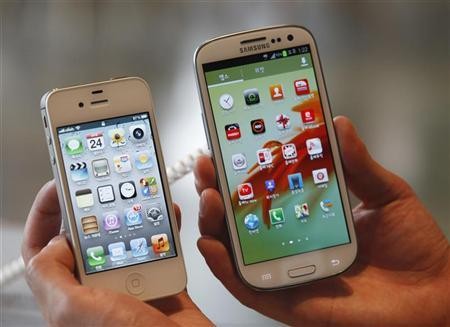
iPhone 4S and Galaxy S III in hand
While iPhone and Galaxy S3 owners are often viewed as fans of rival teams, the two groups have more in common than Apple or Samsung would care to admit.
A new report finds owners of the two smartphones follow the same usage patterns, while maintaining some distance on hardware and carrier choices.
Based on surveys conducted in January and February, both iPhone and G3 owners follow a trend away from voice calls and emails to texting. Before anyone thinks the two will for a mutual admiration society anytime soon, there are some striking differences, as well…
AppleInsider cited a Consumer Research Partners survey which states that between 80 percent to 90 percent of iPhone and S3 owners use their handsets to send multiple texts each day.
There is only a slight difference between the two smartphone platforms when it comes to going online: more than 80 percent of iPhone owners use their device to reach the Internet, while 75 percent of G3 users launch an Internet session from their phones.
While few iPhone or Galaxy S3 owners used their phones to call someone, there was a slightly larger number of S3 users who dialed digits.
In another area, the advantage of the iPhone’s Retina Display may be a factor.
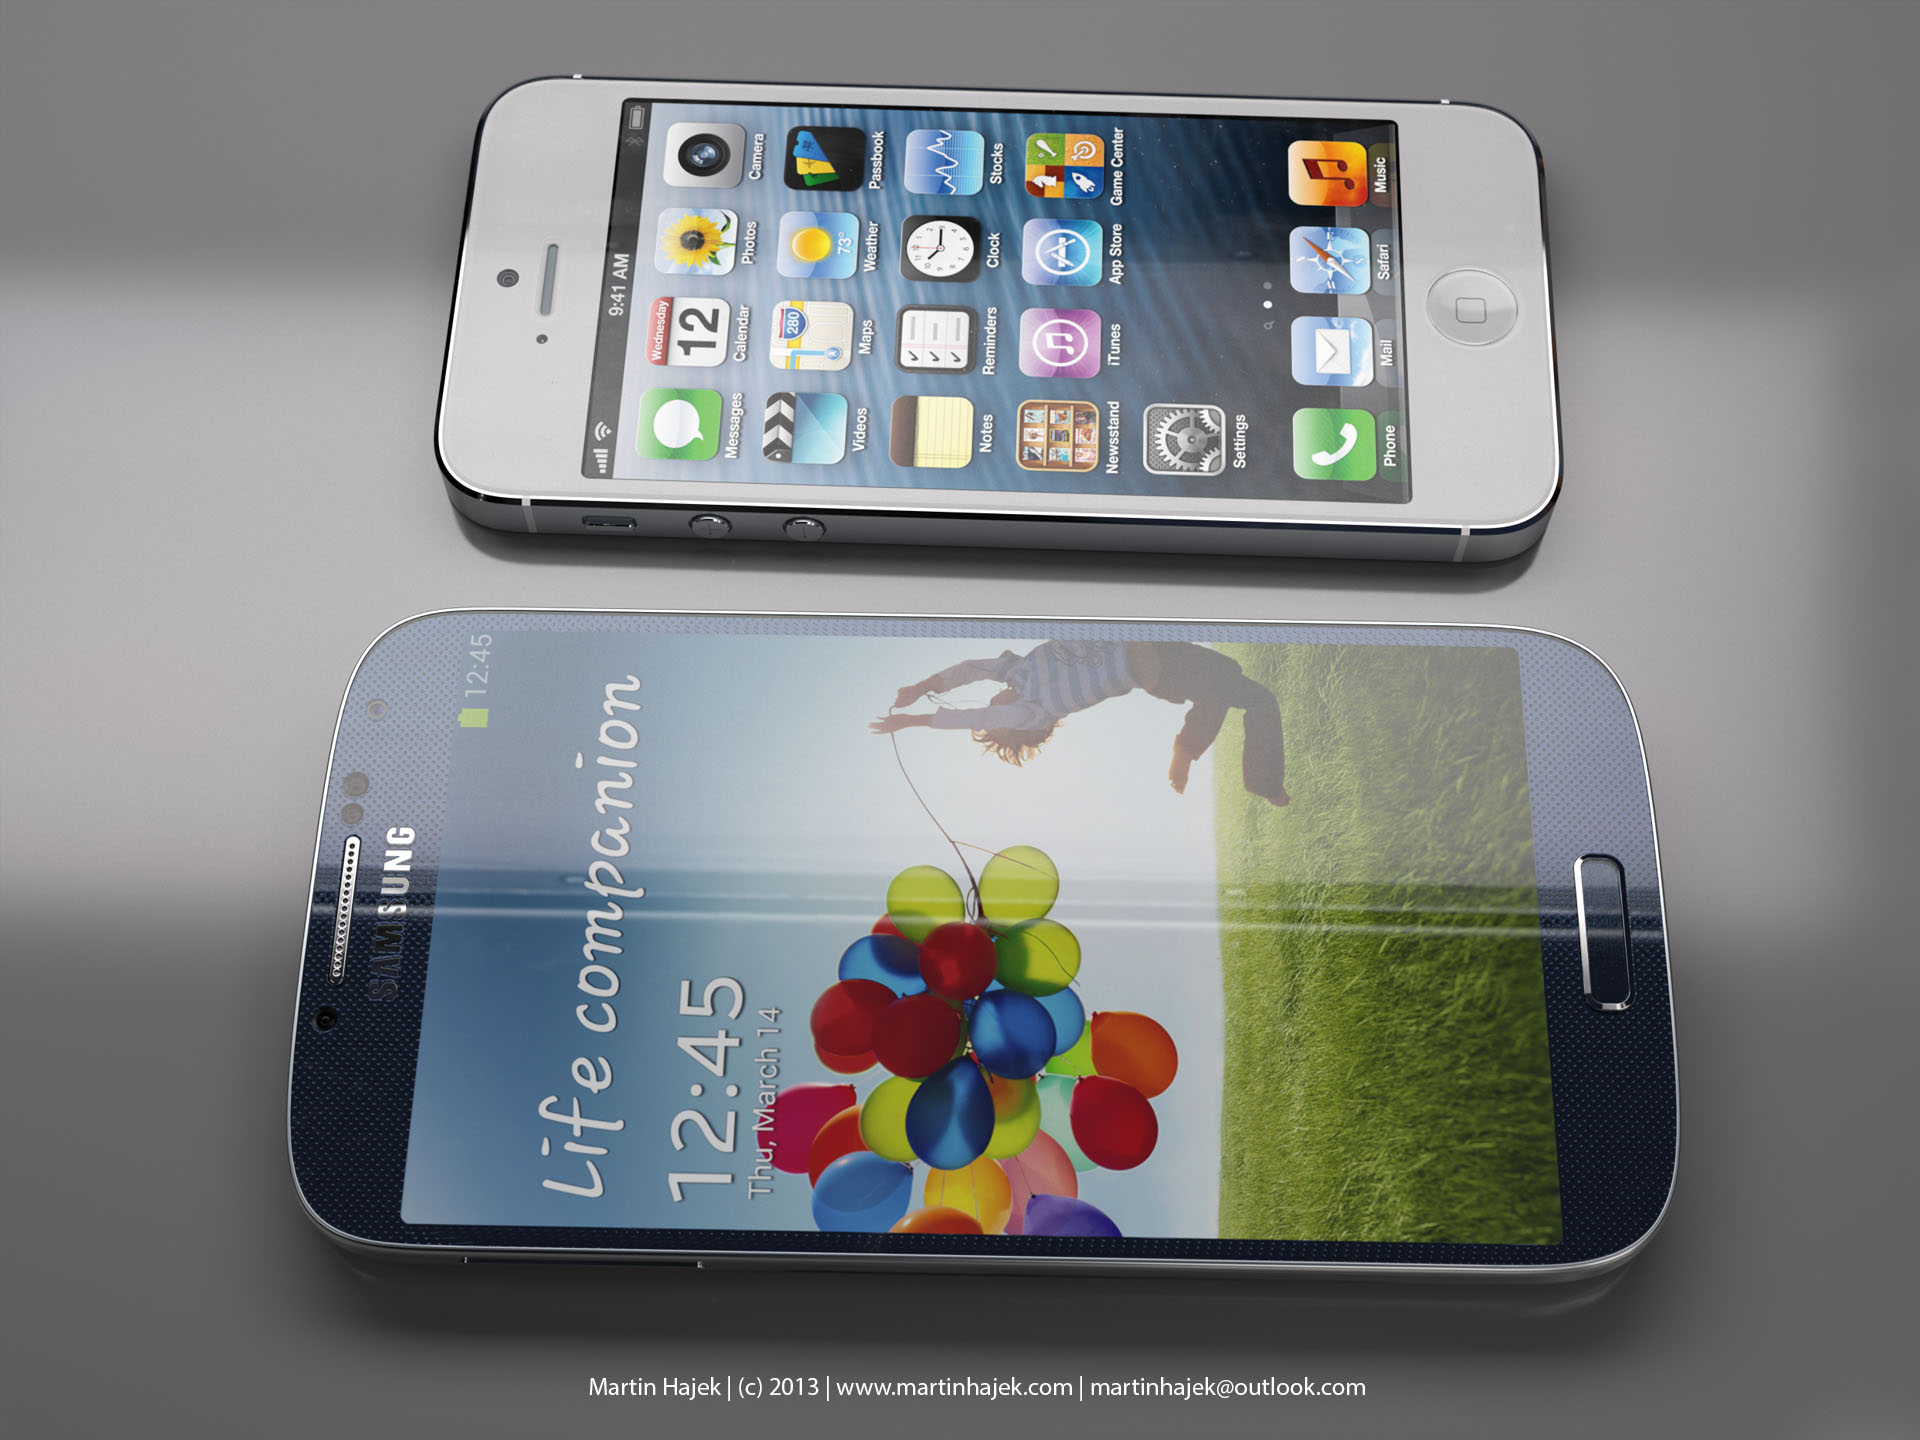
Size comparison (Galaxy S4 vs iPhone 5, Martin Hajek 004)
Owners of iPhones reported more often using the handset to play games or view photos one or two times per day. Although 80 percent of iPhone owners said they often played games on their phones, that figure dropped to 70 percent for S3 users.
When it comes to other hardware, there were more disparities between the two groups.
While both iPhone and S3 owners said they owned PCs, iPhone owners were more likely to own a Mac laptop or desktop, according to the report. The research also found while 20 percent of iPhone owners also have a Mac laptop, just 7 percent of S3 owners said they own a Mac laptop.
In other words, an Apple laptop owner is more likely to buy an Apple smartphone than an Android-based G3 owner is to cross “party lines” and purchase a Mac.
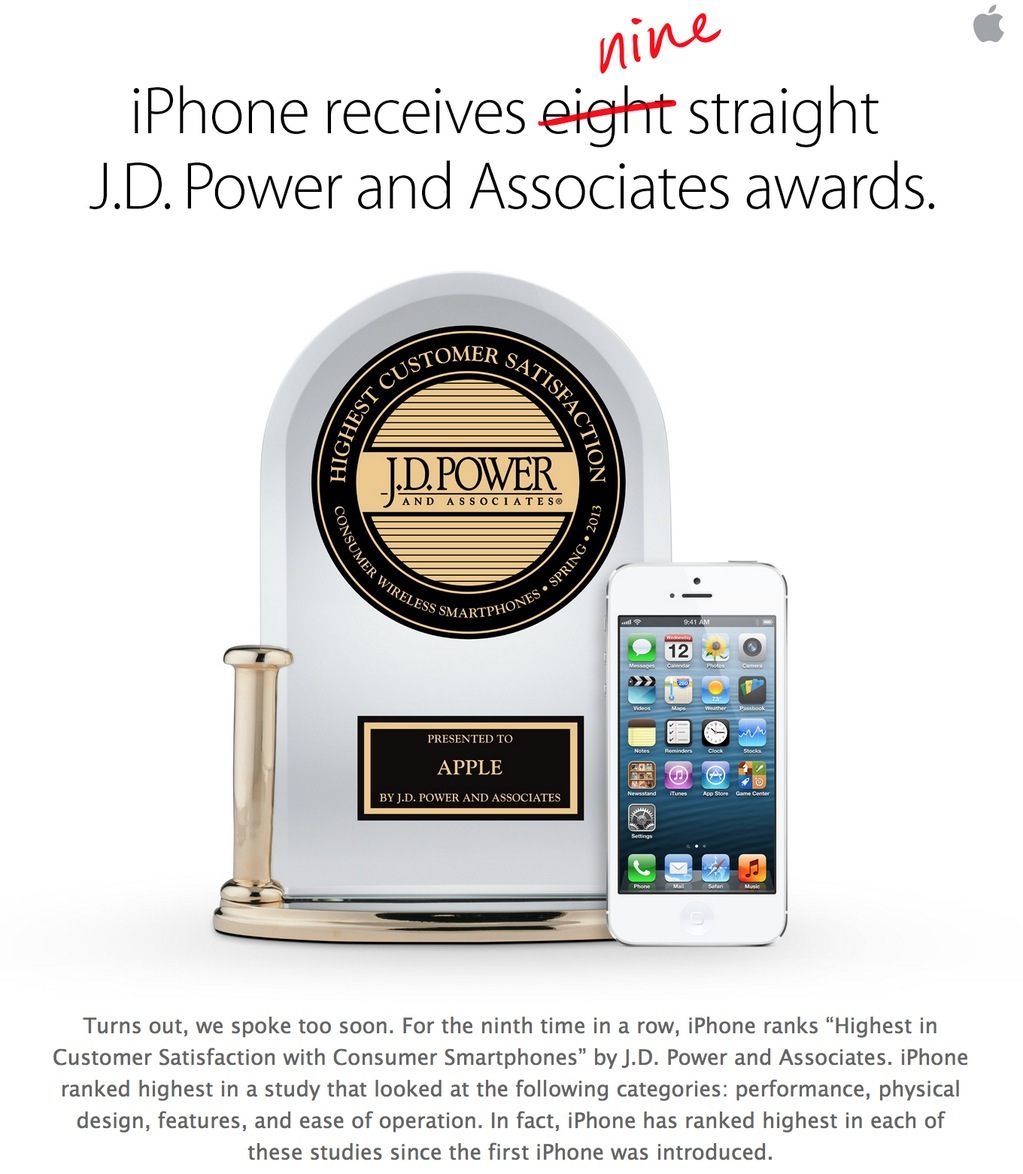
JD Power iPhone 201303
Apple today amusingly emailed out its ninth JD Power award to users (kudos to Mark Gurman).
That line against cross overs also includes tablets. iPhone owners are twice as likely to buy an iPad, while Galaxy S3 owners are twice as likely to own an Android tablet. Of interest to Amazon: iPhone owners are more likely to have a Kindle e-reader, as well.
Despite iPhone owners having three U.S. carriers supporting their Apple smartphone, AT&T – which was Apple’s original partner – has more than 50 percent of iPhone users, according to the researchers.
Verizon has around 35 percent of iPhone owners, while a bit more than 10 percent of iPhone owners are Sprint customers. For the S3, there is no apparent carrier preference with Galaxy owners evenly spread across the four domestic wireless providers.
Read More